
Many Visio users discover how to insert fields into the text of Visio shapes to display data contained in Shape Data fields. But they become frustrated when they add multiple text blocks to grouped shapes, as the process becomes more tricky. Let’s take a look at how to do this!
As you may or may not know, you can insert fields into shape text using the Insert Field dialog. With this technique, you can display Shape Data field values in a shape’s text, along with User-defined cells data, or any valid ShapeSheet expression.
For this article, we’ll start with the Excecutive chair shape, located on the Shapes > More Shapes > Maps and Floor Plans > Building Plan > Office Furniture stencil. The furniture shapes have been nicely updated in Visio 2016 (or Visio 2013? – I need to check), and this one’s a beauty!
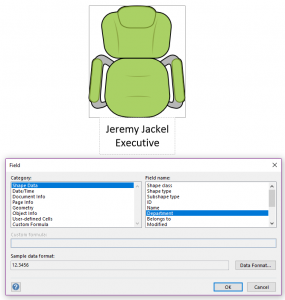
To add some data to our Executive chair shape, we can follow these steps:
Below, I’ve don this twice, adding a new line between the two fields I referenced. Now our shape shows the Name and Department fields of the shape.
click to view larger image
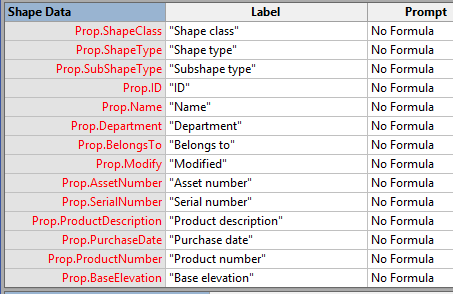
We can check that the references are “fo’ real” by looking at the Shape Data panel for the chair:
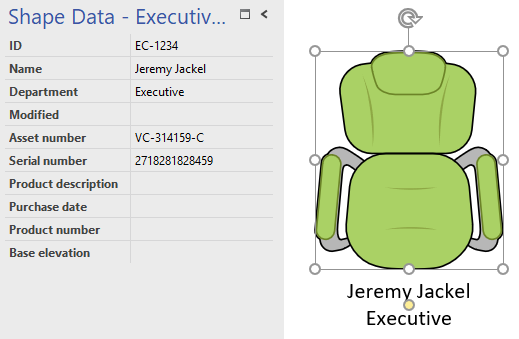
Looks good!
Suppose you want to add text to different locations relative to the shape? There are many reasons why you might want to do this:
Whatever the reason, if you need more than one text block on a shape, then you need to add subshapes within a grouped shape to hold additional text. Visio shapes can only have one text block. If you have a grouped shape, then the group has only one text block, but each subshape can also display text.
Luckily, our Office chair is already a group, so we don’t have to go into the details of creating a group right now. But we’ll need to get inside the group to add a shape to contain text. To do this, try these steps:
Now you’re ready to link the text on your new subshape to data that the group carries. So you press Ctrl + F9 again, and…
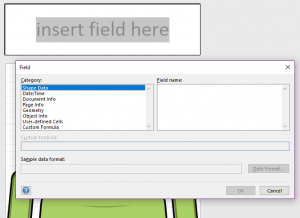
click to view larger image
Where’s the data? There are no Shape Data fields listed! What are we going to do?
The problem is that Visio is looking at the selected shape to get the offerings of fields to insert. The simple text rectangle that you’ve just drawn has precious little to offer. It’s the group that has all the juicy shape data, and after all these years, Microsoft still hasn’t updated this dialog to make it easy to access the group’s data.
Now I mentioned earlier that you can insert a field that represents any valid ShapeSheet expression, and similar to Excel, Visio’s ShapeSheet can “reach out across boundaries”, so to speak. You can get to the group, but you have to know its ID first.
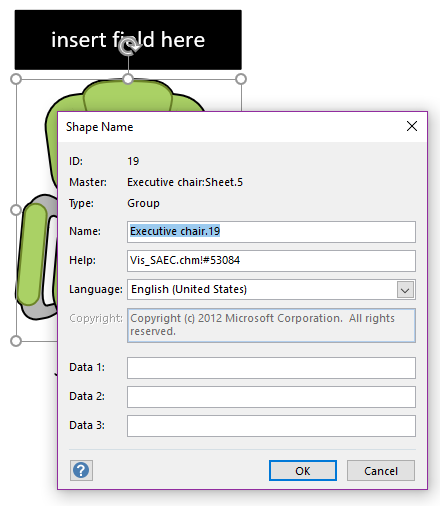
For our example, we can see near the top of the dialog that our group’s id is 19.
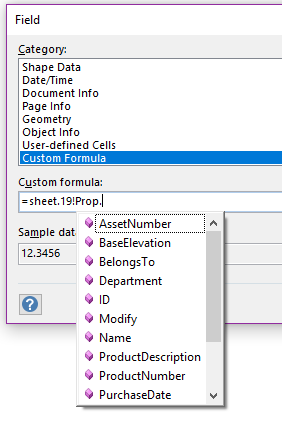
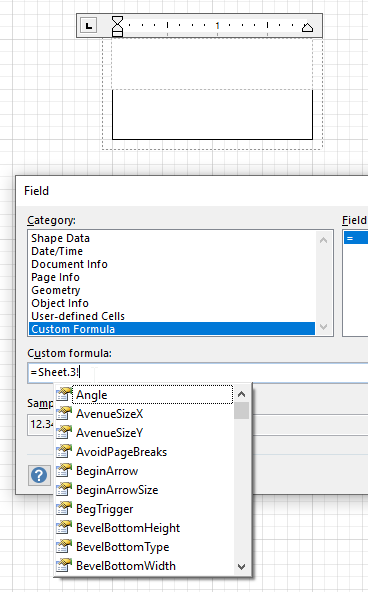
Now, we can go back to where we were before. Get into the window, select our text subshape, enter text-edit mode, and hit Ctrl + F9. At the bottom of the Category list, we’ll need to select Custom Formula.
If we start typing in the Custom formula field below the list:
S h e e t . 1 9 ! P r o p .
We will see a list of shape data fields as soon as we hit the last dot after “prop”
Of course, your shape’s id probably won’t be 19.
A historical note: Shape Data used to be called Custom Properties in Visio. If you peek inside any ShapeSheet behind every Visio shape, the Shape Data section still displays rows that start with Prop.:
For our example, I’ll enter Custom formula = Sheet.19!Prop.SerialNumber, like so:
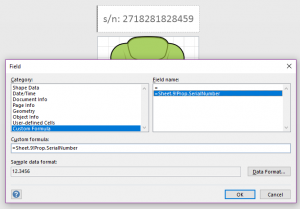
click to view larger image
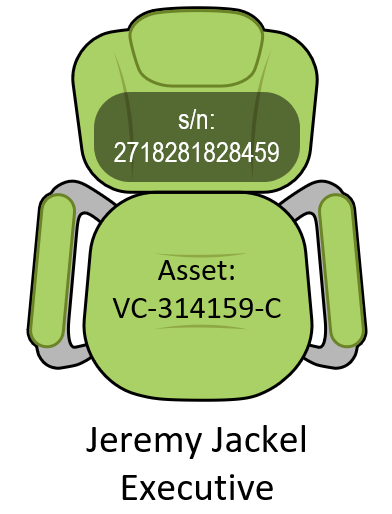
and voila! We’ve now got the serial number (plus a bit of additional text and styling) nicely showing text at a separate location on the chair:

…and that’s fine, as long as you only want to use the default text block of the shape. In the case of the chair, this isn’t a terrible thing, as the office furniture has a text block which is easily repositioned using a control handle.
With our new skills, we can add more fields, rearrange their positions and give them styling that makes them better blend with their parent shape:
You may want to have multiple text blocks on a shape for a myriad of reasons. But if your need is to specifically display shape data, then there may be be alternatives that better suit your needs–especially if you need to view different sets of data at different times.
I suspect that a large fraction of cases might be better suited to the methods that follow.
If you have a “Professional” edition of Visio 2010, 2013, 2016 or newer, then you have the ability to apply data graphics to shapes. Data graphics are sets of adornments that can take the form of
where each field that you want to display takes on one of the items listed above.
You can define several data graphics for a document, then choose which ones to apply. So one data graphic might show asset and serial numbers, while another data graphic would show the name and department associated with the shape. You wouldn’t need to follow all of the customization steps in this article, you just define a data graphic, apply it to a selection of shapes, then change or remove the data graphic as needed. This is great, because you don’t need to alter the structure of your shape at all!
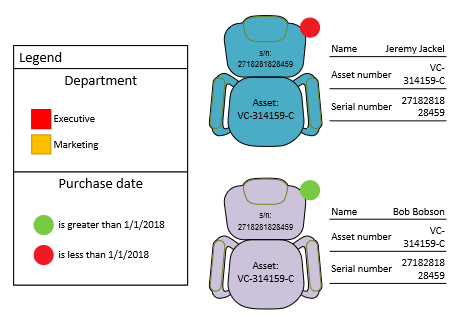
Below, we’ve created two chairs, each containing different data. The main text has been cleared, but a custom data graphic has been applied, This data graphic shows:
Visio also includes a legend so that color by value and icon sets are more easily understood:
You can also add a callout to any shape on the page via: Insert > Diagram Parts > Callout. These callouts have no automatic access to the data of the shape that they are pointing to, but now that you know about expressions like Sheet.19!Prop.SerialNumber, you can easily Ctrl + F9 insert a custom formula field into the text of the callout.
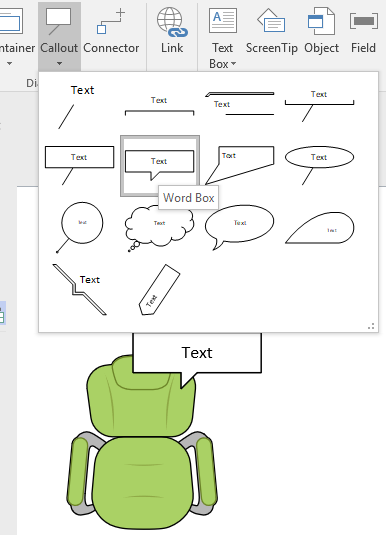
Callouts are nice in that they can be freely repositioned relative to the shape they are pointing to, but they move with their target shape. In addition, if you copy the target shape, the callout gets copied, and if you delete the target shape, the callout gets deleted. Pretty slick!
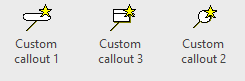
There are older-but-gooder callout shapes that aren’t built into Visio’s Ribbon UI. Instead are gathering dust on the venerable Callouts stencil. You can find the shapes under: Shapes > More Shapes > Visio Extras > Callouts > Custom Callout 1, 2 or 3. (If you don’t find them, it might be a limitation of the Visio Standard edition of the product. I can’t remember off the top of my head if they are included with Standard.)
In the stencil, they look like this:
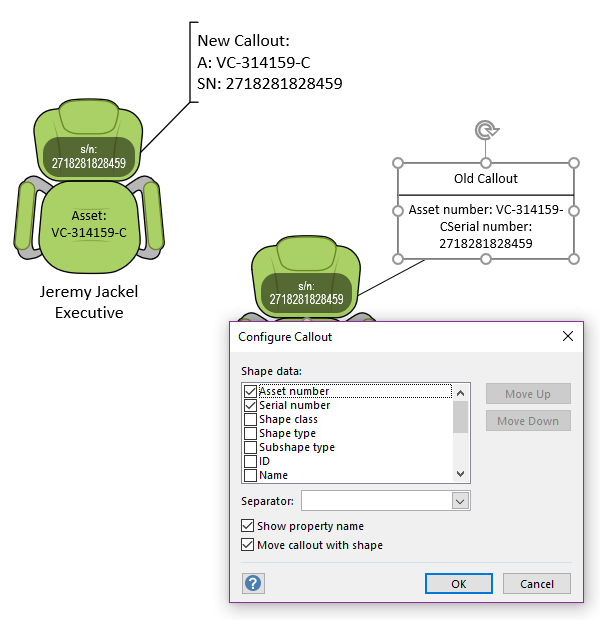
The nice thing about the old callouts is that they pop up a dialog that let you choose shape data on the target shape (right-click and choose Configure Callout… if you don’t see it on drop). They also automatically insert field labels if you check the box! But unlike built-in callouts, they don’t copy nor delete with the target shape.
Here we can see an “inserted-field built-in callout”, along with an old-school callout:
However you choose to display data on your shapes, I hope it is a lot easier for you now!

Unfortunately, all of these are useless because you cannot use those fields to edit the Shape Data. Typing into any of these fields just results in it converting to a regular text field and the shape data will no longer be displayed.
I guess that’s why I chose the title “Link Fields to Subshape Text” and not “Link Shape Data Fields to User-typed Text”.
Excellent information and works like a charm. Much appreciated!Thanks, I am building a title and revision block for our drawing to match our standard layout format and this is exactly what I needed to know.
I don’t know if you will respond, but I’ve used this feature for several years, but just as of 2020 tried to do this again but when I go to Insert Field, and try to enter a custom formula it no longer shows =sheet.## as a command. Has the command been depreciated in some recent update?
Hi MagnAxiom, I use Visio Professional for Office 365, and it still works as discussed in the article. With a sub-shape selected, you have to type the Sheet.N! portion manually. As soon as you type !, you will see the drop-down list of cells in sheet N:
Hi Visio Guy, Great post – its exactly what I was searching for. Almost 🙂 I’m trying to create a stencil for a process step where I can show the process step in the middle of three boxes, with inputs and outputs in the other 2. I’ve got the group shape data fields to display in the boxes I want, but I can only put one ‘Input’ in my input field. If I want my text box to have a bulleted list, can I do it with multiple entries to the one ‘Shape Data’ field – maybe seperated by semi-colons?that has multiple inputs (that I will bullet format in my text box)? As a fall-back I’m thinking I might have to have a series of Input1, Input2, Input3 fields and put a custom field for all 3 in the one text box to bullet the results. But it’s not an elegant solution, and limited me to a hard ceiling on the number of inputs I can list. Any suggestions for a better solution? Thanks!
Hey – thanks for the quick reply. What you are suggesting (adding multiple fields) was my fall back option. What I would like is to add one field.
The question is – can I enter a list in a single shape data field?
i.e. Can one Shape Data field contain the following
‘Item 1,
Item 2,
Item 3,
Item 4.’ I’m just showing 4 items, but can have 10+, and I want to avoid having 10+ Shape data fields that are mostly but not always blank as it would force me to setup my input box and my output box with 10 lines each that then impacts on routings, etc.? I’d paste in a picture but don’t see a control for it? Thanks, Brian.
Yes, you can. It gets tricky if you want to NOT insert line breaks if the before, after, or both fields are blank. Just doesn’t work well with spreadsheet logic. But the basic way I do it is to Insert Field > Custom Formula. Then us use CHAR(10) to add line breaks. So: Prop.Cost & CHAR(10) & Prop.Department & CHAR(10) & Prop.Manager
You can enter a new line in a Shape Data field by typing Shift + Enter, btw!I’ve been using to get an additional line. Thanks.
Now the challenge / question is how to make the shape data field appear as a multi-line box? Can it be done? Thanks, Brian.
Hello Visio Guy, first that all I really appreciate all the info you have published. This post helped me a lot, I was able to calculated the area for two shapes, and in a third shape, add up the area of the first two shapes, and display it. The numbers automatically update as I modify the dimensions of the first two shapes. Awesome!
But this was a heavily manual process, since I needed to get the ID for the first two shapes and manually capture the formula in the third one.
Could you help to clarify how to work for the following challenge?
I want to create stencil with limited amount of ingredients with a couple of variables (e.g. Power and Cost). I want to interconnect them and automatically start doing the math to show the total power and cost of the ingredients added, if possible having containers with different recipes and sub totals and gran total as well. How can I do this without searching for the ID of each new added shape?
-Ed
Great post! Is it possible to have a data field that takes a URL and have the resulting shape be clickable to the URL location. I am working on a report of items and want to have “deep links” to the underlying item. I can manually apply a URL, but would prefer this to be data driven.
Second question. Have you tried this for setting the Heading of a container? It appears that the Container has a limited view of it’s own data. The workaround I found is using a User data field that points to the Shape Data field.